viernes, 20 de abril de 2012

SAP HANA InnoJam Online Contest - The Recap


After a long and very...let's say colorful trip back to Montreal, I have finally some time to blog about the SAP HANA InnoJam Online Contest.

The contest finals were held in the Big Dipper Room in the SAP offices in Palo Alto from 2:00 to 5:00 pm (Believe it or not, we wisely all the expected time).

At first, the teams were getting some time to set-up and get everything ready...


Slowly, people start to fill the room...


Anne Hardy and Barbara Holzapfel kick-off the day introducing the history of InnoJam and the agenda...


I presented the teams and the judges (but there's no pictures about it... -:( ) 


So...here are the judges...

Vijay Vijayasankar - Associate Partner & Head of forward Engineering, Global SAP Practice at IBM
Irfan Khan - CTO for Sybase an SAP company
Prakash Darji – Vice President, Solutions GTM, Data Warehousing Solutions & SAP HANA Platform
Barbara Stortz – Senior Vice President, HANA Product Management
Jonathan Reed of JonERP.com – Independent Blogger/Analyst
Aiaz Kazi – Senior Vice President, Solution Marketing
David Dobrin - President, B2B Analysts

Nice list, huh?

Also...we had a couple of special guest...Vishal Sikka and Hasso Plattner...if you don't know who they are...go to Google and then look for another job...if you're anyhow SAP related, there's no way you don't know them -:)


Ok...let's go the teams now...this is what the contest is all about, right? Let's hope I remember the order of the presentations...

Handling Big Data and reporting for Gas Transportation by Ronald Konijnenburg, Hans Bouwers and Rob Beeren


They mixed SAP HANA and Apple’s Siri to ask questions and get back answers related to the Gas Transportation problem, which is, having to deal with huge data. Sorry I don't have pictures....also...you have to see it live -;)

Improve the Estimation of Train delays with SAP HANA by Andreas Profitlich


Andreas used SAP HANA as a repository for tons of information about trains schedules, and using a mathematical algorithm determine when the train will appear and if there was a delay or not. He also used SAPUI5 which is for sure cool...

Near Real-time Electricity Usage Monitoring and Optimization for Residential Customers by Dharmendra Pandey and Meyyappan Meyyappan


They build and application to determine the best consumption plan for a customer and also to predict which could be the saving when using a new plan. Pretty good if you asked me...specially if you live in Montreal...in the winter...and you're freezing...and need to pay tons of dollars for the heater...

Retail Sales Analysis with dynamic calculations by Adarsha Aswathanarayana and Vijaya Gondesi


They build a solution to have better control on the Retail Sales, managing different factors like different currencies and weight meassures. They used complex calculations and views.

Detective HANA by Peter Chapman


He used SAP HANA, Cellphone information and crime information to develop a system to track suspect and criminals and help the police to grab offenders. He even used PHP and Web Scrapping. And if that's enough...he had a professional drawer doing a nice painting.

CEO Vision by Keytree - SAP HANA + Augmented Reality + Microsoft Kinect by William Powel and Nic Doodson


They used Augmented Reality, Microsoft Kinect and special glasses, a CEO can see data from SAP HANA in Real Time by just looking a magazine or a map in the wall. Totally awesome for sure...and a glimpse of the future...

The judges had a really hard time deciding the 3 first places...all teams did an awesome job...but...only 3 could get choose.

After 15 minutes, Vijay and David gave their comments to all the teams. Which for me, was a really great gesture.


After this, I names the prices and Jon call the 3 winning teams starting from the 3rd to 1st place.


So...here are the 3 winning team...

Handling Big Data and reporting for Gas Transportation (3rd Place) by Ronald Konijnenburg, Hans Bouwers and Rob Beeren


(Somehow...I can't load more pictures...sorry about that )

Detective HANA (2nd Place) by Peter Chapman

CEO Vision by Keytree - SAP HANA + Augmented Reality + Microsoft Kinect (1st Place) by William Powel and Nic Doodson

If you want to know more about the 1st place submission, please visit http://www.keytree,co.uk/ceovision

Sanitizing data in SAP HANA with R


From April 10 to April 11, my team (Anne, Juergen and myself) host an InnoJam in Boston. It was a really great event, but the data provided by the City of Boston wasn't exactly in the best shape, so we took a lot of efforts (with a help of the SAP Guru's that helped us) to sanitize the data.

At some point, as I was asked to use my Regular Expressions skills (everybody knows I'm crazy about RegEx) to sanitize some data that came into a really weird format inside a field...something like this (Can't post the real data for obvious reasons):

Type: [This is a test] Area: [My Area] Description: [This data is not right]

What I need to do was basically, took each record and generate a new table with those 3 fields and end with something like this...

TypeAreaDescription
This is a testMy AreaThis data is not right


I began to think on which language could be the best for the job...I thought on ABAP, Python...and then of course...R...so I choose R.

The problems that immediately arise were simple, how to pull data from HANA and how to send it back, also, even when I believe myself a RegEx Hero, R uses a not very standard RegEx schema. I thought on downloading the data from HANA as .CSV, clean it up and then upload the .CSV back to HANA...but then I thought that the extra work was not worth it...so then...my good old friend RODBC came into the show...even when it's not supported by SAP, I decided that for this particular case, it would be just fine...I could read the data back and forth and have everything back into HANA in a very fast way.

Let's create a table and call it BAD_DATA...and just create 10 dummy records (I know...I'm lazy)...


So this is the script:

library("RODBC")
ch<-odbcConnect("HANA_SERVER",uid="P075400",pwd="***")
query<-("select case_description from P075400.BAD_DATA")
CRM_TAB<-sqlQuery(ch,query)
 
SR_Type<-c()
SR_Area<-c()
Description<-c()
 
for(i in 1:nrow(CRM_TAB)){
  mypattern = '\\[([^\\[]*)\\]'
  datalines = grep(mypattern,CRM_TAB$CASE_DESCRIPTION[i],value=T)
  getexpr = function(s,g)substring(s,g,g+attr(g,'match.length')-1)
  g_list = gregexpr(mypattern,datalines)
  matches = mapply(getexpr,datalines,g_list)
  result = gsub(mypattern,'\\1',matches)
  var<-0
  i<-0
  for(i in 1:length(result)){
    var<-var+1 
    if(var==4){
      break
    } 
    if(var==1){
      SR_Type<-append(SR_Type,result[i])
    }
    if(var==2){
      SR_Area<-append(SR_Area,result[i])
    }
    if(var==3){   
      Description<-append(Description,result[i])
    }
  }
  if(length(SR_Type)>length(Description)){
    Description<-append(Description,NA)
  }
  if(length(SR_Type)>length(SR_Area)){
    SR_Area<-append(SR_Area,NA)
  } 
}
 
GOOD_DATA<-data.frame(SR_Type,SR_Area,Description,stringsAsFactors=FALSE)
sqlDrop(ch,"GOOD_DATA",errors=FALSE)
sqlSave(ch,GOOD_DATA,rownames="id")
odbcClose(ch)


So basically, but we're doing is to grab all the information inside the brackets, then pass it to vectors to finally create a Data.Frame and send it back to HANA. If you wonder why I'm comparing the length of the different vector to add NA values, it's very simple...we can have something like this...

Type: [This is a test] Area: [My Area] Description: [This data is not right |

The last bracket...it's not a bracket! It's a pipe, so the RegEx is going to fail and this will provoke the vector to be empty and that would be messy...if that happens with can add an NA and at least have a value on it...

So...when we run our program...a new data called GOOD_DATA is going to be created with all the data clean and sanitized.


Nice, right? -;)

See you in my next blog! -:)

When R met SAP Gateway


A couple of days ago, I was toying with the idea of doing something with SAP Gateway...I thought of using SUP, but as I recently wrote 2 blogs about it, I decided to go back to one of my favorite programming languages...R...

So...Gateway can be consumed as ODATA and JSON (If I'm not wrong) is not fully supported, so my only option was ODATA...but R doesn't support ODATA...so I was facing a real problem...

I was wrong -:P ODATA is the protocol and JSON and XML are formats...Gateway generates XML right now and JSON is coming soon...special thanks to Wayne Brown (Solution Owner, SAP NetWeaver Gateway)

Gladly, R is one of those programming languages that comes to the rescue when you less expect them...by browsing around I found a library to do Web Scrapping...which means that basically I will read the whole XML generated by SAP Gateway, parse it to extract the information I need and the generate a nice graphic to impress someone...BTW...I'm filtering to get only the flights of 'AA', as getting the full list of 1,304 records will make it really hard for R to handle as R doesn't really shine when it comes to processing speed...also parsing that huge XML is a little stressful for anyone...

First, I create a simple SAP Gateway service based on BAPI_FLIGHT_GETLIST. Here's the resulting XML:

http://lscies1.sapdevcenter.com/sap/opu/sdata/sap/ZFLIGHT_MODEL/zflightCollection?$filter=airline_1 EQ 'QF'&sap-client=520&$format=xml


Then, I did some nice lines of code in R Studio. Basically, it looks for the line that contains the "cityto" tag and then extract everything else that is not, in order to extract only the name of the city. Then we simply, sort the values, sum them and generate the graphic.

library("plotrix")
 
web_page <- readLines("http://lscies1.sapdevcenter.com/sap/opu/sdata/sap/ZFLIGHT_MODEL/zflightCollection?$filter=airline_1 EQ 'AA'&sap-client=520&$format=xml")
 
mypattern = '([^<]*)'
datalines = grep(mypattern,web_page,value=TRUE)
getexpr = function(s,g)substring(s,g,g+attr(g,'match.length')-1)
g_list = gregexpr(mypattern,datalines)
matches = mapply(getexpr,datalines,g_list)
result = gsub(mypattern,'\\1',matches)
names(result) = NULL
airlines <- sort(table(result), decreasing = TRUE)
lbls <- names(airlines)
 
pie3D(airlines,labels=lbls,explode=0.1,
      main="American Airlines")

And here's the result...


See you next time!

Blag's experiments with SUP - Volume 2


As promised...here's another of my experiments with SUP...this time, I wanted to something more interesting and more complex...something that really gave me an SUP experience...so I took something that I build a long time ago by using PHP and SAP...I'm talking about an SBWP aka. SAP Mail emulation.
Of course, I needed to go back to my ABAP roots and build some RFC enabled function modules.
(The code is a little bit long, so I will upload it along with the SUP code to Code Exchange )
With that ready...we can start doing some SUP business...first, let me show the Model.


It's really easier than it looks. As we have 4 function modules, we create 4 MBO's (Business Model Objects) and we link two of them...the Titles with the Details...


We need to establish a relation between Titles and Details, because we're going to have a screen with the Titles and for each one, we're going to show it's detail.


It's very important to define the Personalization keys, as they are going to pass as parameters for the MBO's.


This is the Personalization for the Send Mail MBO.


With all that explanation, we can take a look at the demo, which is running on a BlackBerry emulator.


As we can see, we can do everything that we could do on the SBWP transaction...but as always -:(  I have a little bug...when the Reply window comes out, the "To:" should be filled, however, I haven't been able to do it yet...after all...SUP is a new technology, and we're all learning how to use it -;)

https://cw.sdn.sap.com/cw/groups/blag-stuff?view=documents

jueves, 19 de abril de 2012

Blag's experiments with SUP - Volume 1


If you know me...you know I love to build blog series...but this time, I'm not going to talk about PHP, Ruby or Python. I'm going to talk about SUP and what can we do with it. Of course, being this my first blog on the matter, I will start with a very basic program, that will read a public web service and return us some information back.
First off all...I gotta admit that I based myself on the great video series created by my friend and team mate Ingo Sauerzapf. For this blog, I'm using the Developer Center for SUP. So the first thing is to open some application in order: Start Sybase Unwired Platform, MD5, 9800, Sybase Control Center and Sybase Unwired WorkSpace.


When we log into the Sybase Control Center, we must create a user for our application.


After we have created our user, we can move to the BlackBerry emulator and choose the "Workflow" application. Which is going to be of course empty, so we need to configure it by going to it's settings.


We're using the same User Name and Activation Code that we used on the Sybase Control Center. Next step is to open the Sybase Unwired WorkSpace and create a new Mobile Application Project and call it "Weather_Convertion". (I know...I have a typo...should be Conversion...but I have all the pictures taken, so you guys corrected when creating your applications).
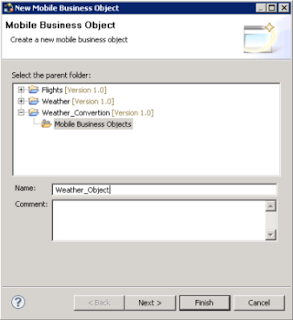
We must create an Mobile Business Object and name it "Weather_Object".


As we're going to use a Web Service, we need to choose it as the Data Source and create a Profile for it, which is basically provide the Web Service to use. We're going to use this one:http://www.w3schools.com/webservices/tempconvert.asmx?WSDL It's important that we change the default String value on the Attributes Mapping to (3)...because 100 it's just too much 
Next step is to create a Personalization Key which we will call CelsiusPK.


On our Mobile Business Object, we should go to the attributes, and then load arguments to establish the personalization key we just created.


After that, a simple right click to Deploy Project would be more than enough.


We're now ready for the next step, which should be the "GUI" to call it in a way...let's create a Mobile Workflow Forms Editor object and call it Weather_Convertion (Again...sorry for the typo), here it's important to check the first checkbox, which will state that our application can be started on demand. When everything is ready, we need drag and drop our Weather_Object into our Form Editor environment.


When it's done, we can double click on the "Start Screen" and add a Menu Item with the name "Get Fahrenheit", with the following options.


We need to link this to our Weather_Object, so let's search it and call it's query operation. Also we can Generate an error screen and set the default success screen, which is the screen which should be shown is everything went right.


It's very important to go to the Personalization Key Mapping and link the Personalization Key with the Object Key.


With that set...we can right click and call the "Generate Mobile Workflow Package...". And we can even assign our application to work only for certain users.


Without a single line of code, we can test our little application and confirm that it's working just fine...


I hope you liked this first blog, even when it's really basic...I promise that my next blog is going to be really nice...might take me a while, as it's not easy, but I'm sure it's going to be something worth to wait for